New curriculum report cards in Uganda: activities, A to E grades and the 20/80 split
Updated 22 October 2026
S.1 to S.4 report cards under the new lower secondary curriculum no longer show D1–F9, aggregates and divisions. Here is what a new curriculum card shows, and how each number on it is worked out, with one learner as an example.
What changed
| Old O-level | New lower secondary | |
|---|---|---|
| Marks during the term | Mid-term exam (MOT) | Activities of integration, scored 0 to 3 |
| Final mark | MOT and EOT, e.g. 40% and 60% | 20% from the activities + 80% end of term |
| Grades | D1 to F9, with points | A to E, with UNEB’s words |
| Overall | Aggregate of the best 8, division I to U | An overall level, and UNEB’s Result 1 to 4 |
1. Activities of integration (AOI)
During the term, each subject gives learners activities of integration: tasks where they use what they have learnt on a real problem. The teacher scores each one from 0 to 3, often with one decimal (2.4). The cards we have seen show one to five activities per subject in a term.
The average of a subject’s activity scores, to one decimal, gives the learner’s level in that subject:
| Average score | Level | In words |
|---|---|---|
| 0.9 to 1.49 | 1 | Basic |
| 1.5 to 2.49 | 2 | Moderate |
| 2.5 to 3.0 | 3 | Outstanding |
2. From scores to a mark out of 100
The activities count for 20% of the final mark and the end-of-term exam for 80%:
Out of 20 = activities average ÷ 3 × 20
Out of 80 = end-of-term mark × 0.8
Total = out of 20 + out of 80
Worked example: Biology, S.2
| AOI 1 | AOI 2 | AOI 3 | Average | Level | Out of 20 | EOT | Out of 80 | Total | Grade |
|---|---|---|---|---|---|---|---|---|---|
| 2.4 | 3.0 | 2.7 | 2.7 | 3 | 18.0 | 58 | 46.4 | 64 | C |
The average 2.7 is level 3 (Outstanding) and gives 2.7 ÷ 3 × 20 = 18.0 out of 20. The exam’s 58 gives 58 × 0.8 = 46.4 out of 80. Together that is 64.4, printed as 64, which is a C, Satisfactory.
If a learner missed an activity, leave it out of the average rather than counting it as zero, and say so on the card if your school does.
3. Grades A to E
UNEB grades every subject from A to E, each with its own words. The marks for each grade below are what most schools print on their cards; use your school’s if they differ.
| Grade | Marks | Achievement level | What it means (UNEB) |
|---|---|---|---|
| A | 85–100 | Exceptional | An extraordinary level of competency, applied innovatively and creatively in real life |
| B | 70–84 | Outstanding | A high level of competency |
| C | 60–69 | Satisfactory | An adequate level of competency |
| D | 40–59 | Basic | A minimum level of competency |
| E | 0–39 | Elementary | Below the basic level |
4. What a new curriculum card shows
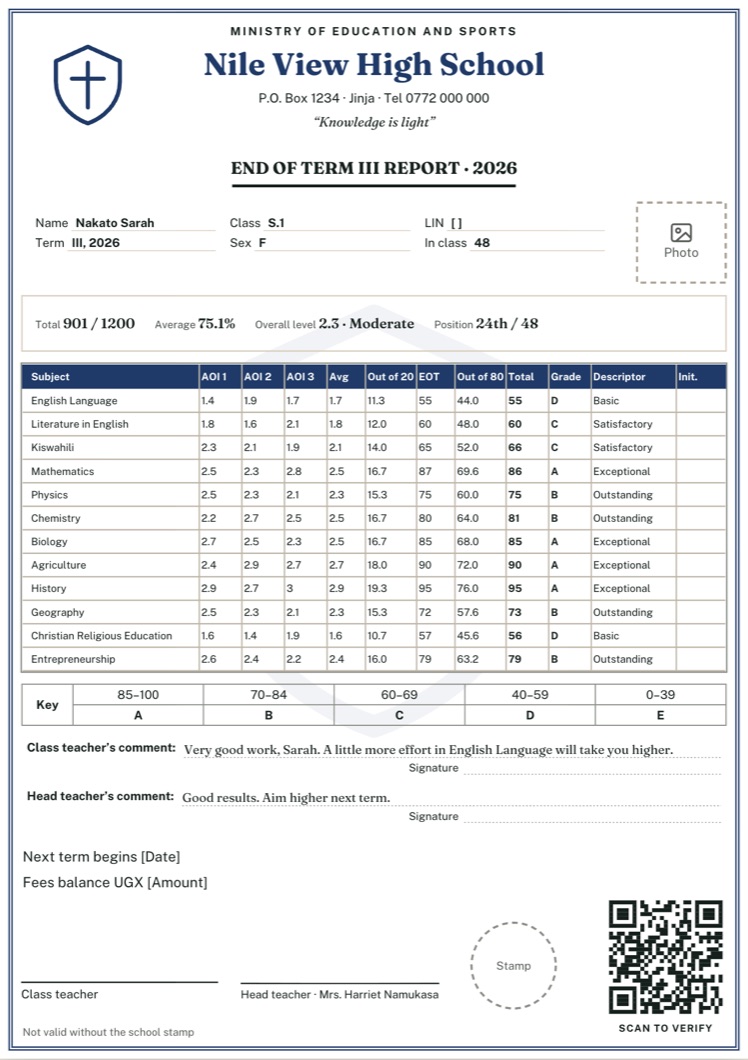
- For each subject: the activity scores (AOI 1, AOI 2…), their average or level, the mark out of 20, the end-of-term mark and its mark out of 80, the total out of 100, the grade and its words, and the teacher’s initials.
- Overall: the average of all the totals, the overall level (the average of all the activity scores, e.g. “2.5 · Outstanding”) and, if the school ranks learners, the position.
- Keys: the grade key (A to E with their marks) and the level key (1, 2 and 3), so parents can read the card.
- Comments from the class teacher and the head teacher. Some schools add each subject teacher’s remark and the learner’s generic skills.
- Result: some schools print UNEB’s overall result. UNEB uses Result 1 for candidates who qualify for the certificate, 2 for those who did not fulfil its conditions, 3 for those below the minimum level in all subjects, and 4 for those partly or fully absent.
Questions schools ask
Are there still aggregates and divisions in lower secondary?
No. Under the new lower secondary curriculum each subject gets a grade from A to E, and UNEB gives an overall Result 1 to 4 instead of a division. Primary schools (PLE) still use aggregates and divisions.
Does every school use 85, 70, 60 and 40 for the grades?
UNEB publishes the grades and their descriptors, A Exceptional to E Elementary. 85, 70, 60 and 40 are the marks most schools print on their own cards; some use others, so use your school’s.
Is the 20% from activities fixed?
NCDC’s guidance gives 20% to the formative part (the activities) and 80% to the end-of-year or end-of-term assessment. Most schools follow it; a few add a mid-term exam to the 80%.
Free: new curriculum continuous assessment sheet (Excel)
One class and subject: type up to five activity scores and the end-of-term mark, and the average, level, out of 20, out of 80, total, grade and descriptor work themselves out. Opens in Excel and Google Sheets.
Report Card Studio is ready for the new curriculum
Choose “Activities and end of term” for your secondary classes. Teachers send each activity’s scores and the end-of-term marks through Google Sheets, and every learner’s average, level, out of 20, out of 80, total, A to E grade and overall level are worked out and printed on your own card design. Free until you print.
Sources: UNEB circular on the release of the 2024 UCE results (10 February 2025); NCDC guidance on reporting learner achievement under the new lower secondary curriculum (7 November 2022); schools’ own report cards.
Also read: report card comments with examples →